🌍 Seasonal Forecast Models Evaluation Pipeline
Author: Esmaeil Pourjavad
Domain: Data Science | Predictive Modeling | Satellite Data
📌 Project Overview
This work is part of Sphere, a large European project on water availability and climate prediction.
Here I present only my contribution: the design and implementation of a seasonal forecast evaluation pipeline.
The project delivers an end-to-end data science workflow for evaluating and benchmarking predictive models at scale.
Although applied to seasonal climate forecasts (Copernicus C3S multi-model datasets, 1993–2015), the pipeline’s design, tooling, and methodology are generalizable to domains like finance, insurance, and risk analytics.
The workflow operationalizes the full lifecycle:
data ingestion → preprocessing → feature engineering → model evaluation → visualization & reporting,
providing reproducible, automated, and scalable analytics for decision-making under uncertainty.
⚙️ Pipeline Components
1️⃣ Data Acquisition & Orchestration
- Automated ingestion of multi-model forecast data
- Batch workflows orchestrated with Bash + Slurm on clusters
- Integrated validation, error handling, and logging
- Storage in standardized NetCDF
Keywords: ETL pipelines · workflow orchestration · API integration · data validation
2️⃣ Data Preprocessing & Feature Engineering
- Harmonized datasets with xarray, NumPy, CDO
- Regridding, normalization, resampling, detrending
- Derived predictors (e.g., wind speed, anomalies)
- Baselines and anomaly features for ML models
Keywords: data wrangling · anomaly detection
3️⃣ Model Evaluation Framework
- Brier Skill Score (BSS): categorical probabilistic accuracy
- Continuous Ranked Probability Skill Score (CRPSS): distribution accuracy
- Area Under the ROC Curve (AUC): discrimination ability
- Anomaly Correlation Coefficient (ACC): deterministic forecast–observation correlation
Framework implemented in Python (xarray, NumPy), R for multi-model benchmarking.
Keywords: benchmarking · probabilistic forecasting
4️⃣ Visualization & Reporting
- Geospatial maps (Cartopy + Matplotlib)
- Comparative boxplots & heatmaps (Seaborn)
- Dashboards for decision support & scientific communication
- Publication-ready outputs (reports, posters, dashboards)
Keywords: geospatial visualization · statistical dashboards
📊 Tech Stack
- Languages: Python, Bash
- Libraries: xarray · NumPy · pandas · matplotlib · scikit-learn · seaborn · cartopy · cdsapi
- Tools: CDO (Climate Data Operators), Slurm (HPC orchestration)
- Data: Seasonal forecasts (ECMWF, CMCC, DWD, MF, UKMO) + ERA5 reanalysis
- Environment: Linux HPC cluster, NetCDF workflows
📊 Example Results
Some outputs from the evaluation pipeline:
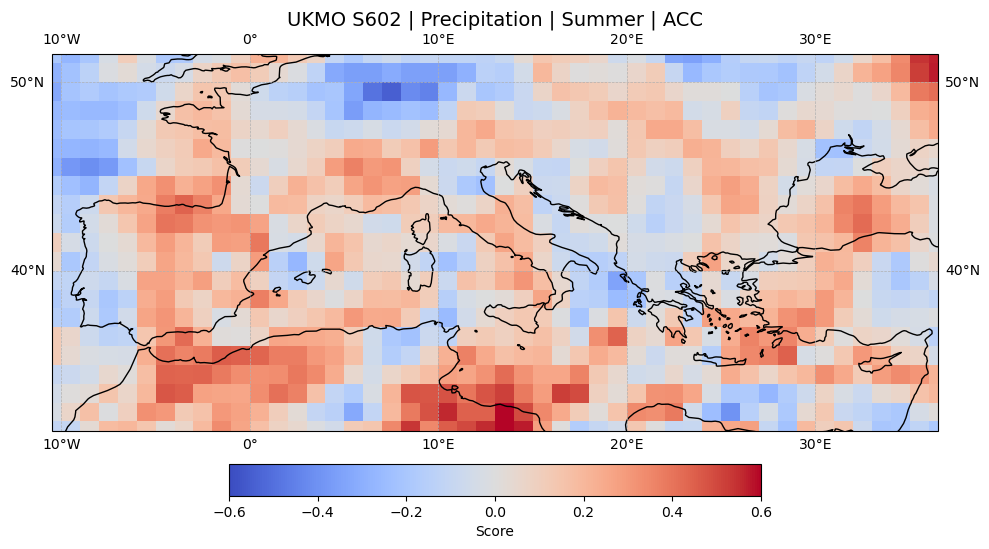
Spatial Map
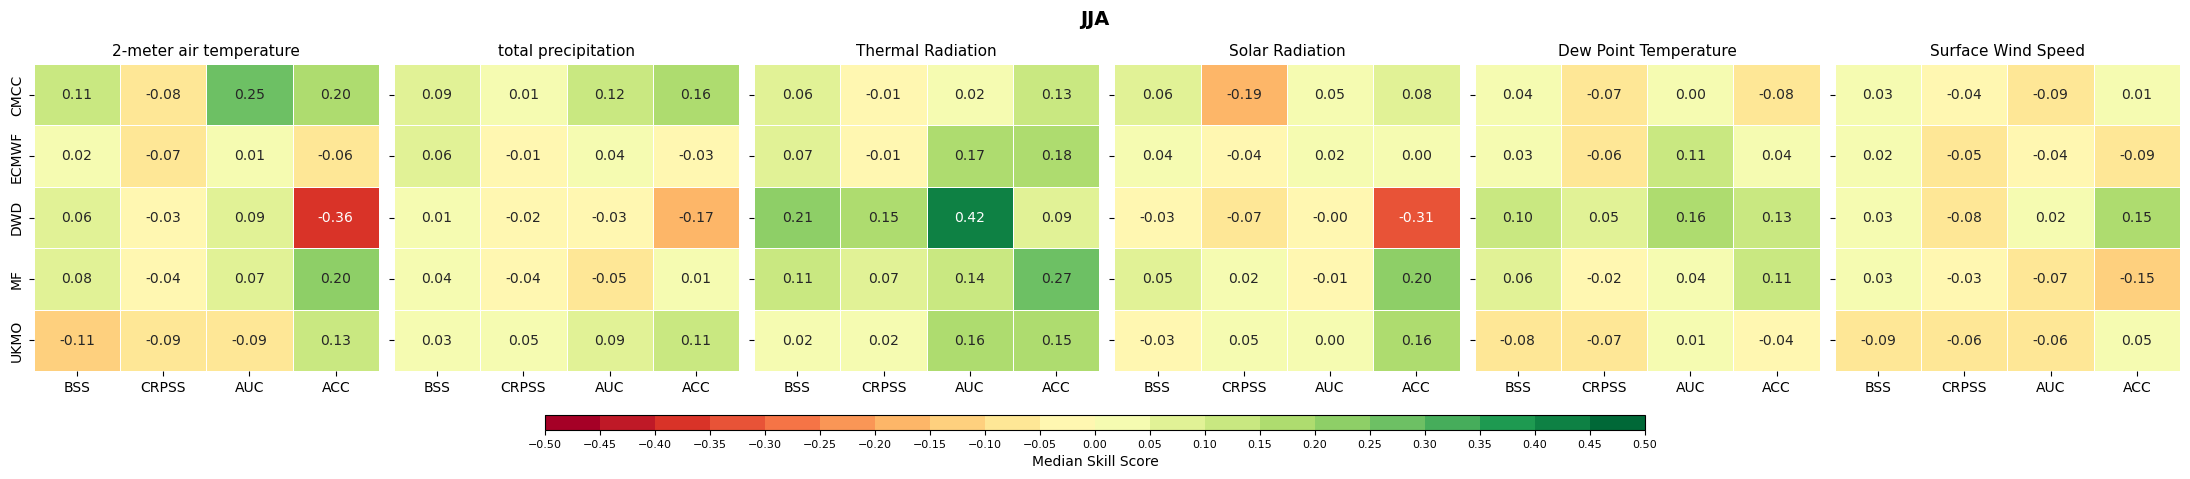
Heatmap
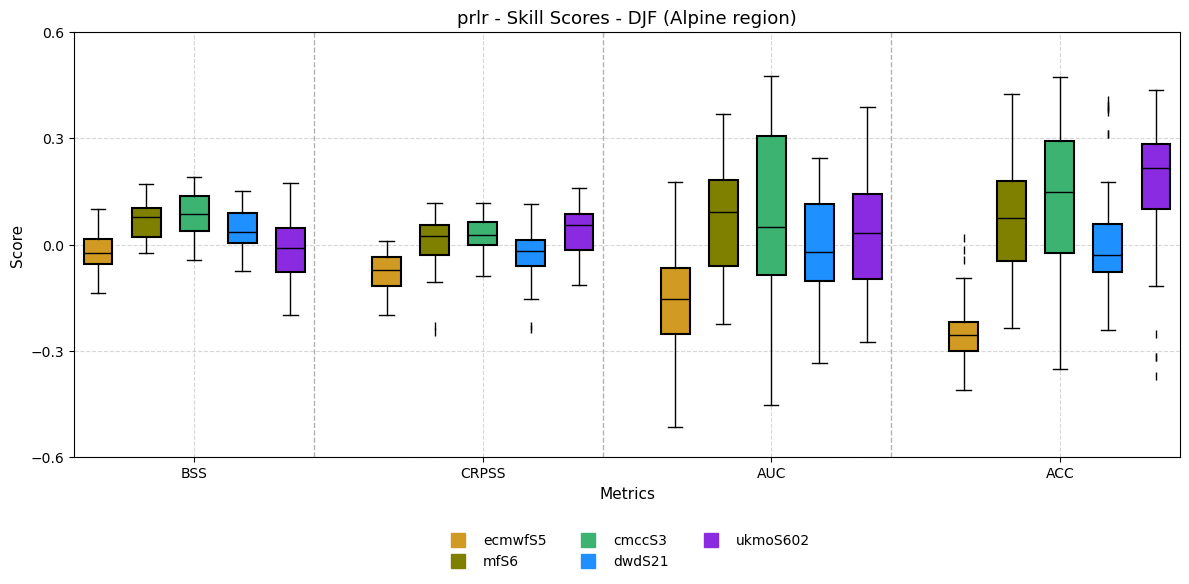
Boxplot
📂 Code Snippets
- Data Preprocessing (Bash) → harmonization & anomaly computation
- Model Evaluation (Python) → skill score calculations
- Visualization (Python) → geospatial & statistical plots
(Full pipeline code is maintained privately due to project restrictions; here are representative excerpts.)
🔑 Data Science Relevance
- Data Engineering → scalable ingestion, ETL pipelines, heterogeneous data harmonization
- Feature Engineering → anomalies, derived predictors
- Model Evaluation → probabilistic/deterministic metrics, reproducible benchmarking
- Visualization → dashboards, publication-ready figures
- Scalability & Reproducibility → HPC orchestration, modular design, logging
Applicable beyond climate science → insurance, finance, risk scoring, fraud/anomaly detection.
🎤 Conferences & Publications
- Conference Presentation:
- Publication:
Springer Nature – Climate Dynamics (final preparation phase)